Best Network Topology Tools in 2026
Compare the best network topology tools for documentation, manual diagrams, automatic discovery, and live monitoring, with practical picks for different networks.

On this page
- At a Glance: Network Topology Tools Compared
- 1. Obelinf: Best for automated, documentation driven topology
- 2. diagrams.net: Best for manual network diagrams
- 3. LibreNMS: Best for self hosted network discovery
- 4. PRTG: Best for maps connected to monitoring
- 5. SolarWinds Network Topology Mapper: Best for automated Layer 2 and Layer 3 maps
- How to evaluate a network topology tool
- Run a small topology pilot
- Which network topology tool should you choose?
Network topology tools solve different problems. Some give you a blank canvas for drawing, some discover device relationships from the network, and others display topology alongside monitoring data. A diagram can look polished and still be wrong if it is disconnected from the records your team updates.
Our top pick is Obelinf when you want the topology to stay connected to your infrastructure documentation. The other tools below make more sense when automatic discovery, monitoring, or freeform drawing is the main requirement. The right choice depends on whether you need a map of what you recorded, what the network discovers, or what is happening right now.
At a Glance: Network Topology Tools Compared
| Obelinf | diagrams.net | LibreNMS | PRTG | SolarWinds NTM | |
|---|---|---|---|---|---|
| Deployment | Hosted service | Web or desktop app | Self hosted | On premises or hosted | Installed software |
| Topology source | Maintained infrastructure records | Manually drawn | Discovered neighbor and MAC data | Devices and monitoring data | Automatic network discovery |
| Best for | Connected inventory and topology | Custom diagrams | Network discovery and monitoring | Live maps with monitoring | Layer 2 and Layer 3 discovery |
| Pricing | Free Personal plan, paid plans available | Free | No license fee, self managed | Free edition and paid subscriptions | Paid, 14 day trial |
1. Obelinf: Best for automated, documentation driven topology
Obelinf is our first pick for teams that want to automate network documentation without maintaining a separate drawing. Add sites, devices, interfaces, and connections directly, or connect an AI assistant to a source such as AWS and Obelinf over MCP. The assistant can inspect the cloud inventory and create structured records for review. Obelinf then generates an interactive diagram from those records through the network topology view.
This is not live network scanning or status monitoring. The agent gathers information from the connected source, and Obelinf visualizes the documented relationships. That distinction makes it useful when your goal is to automate the first draft of a dependable reference for troubleshooting, change planning, or onboarding, rather than a map that reports whether devices currently respond. For the AWS setup and its review steps, read Automated AWS Network Topology Diagram with AI.
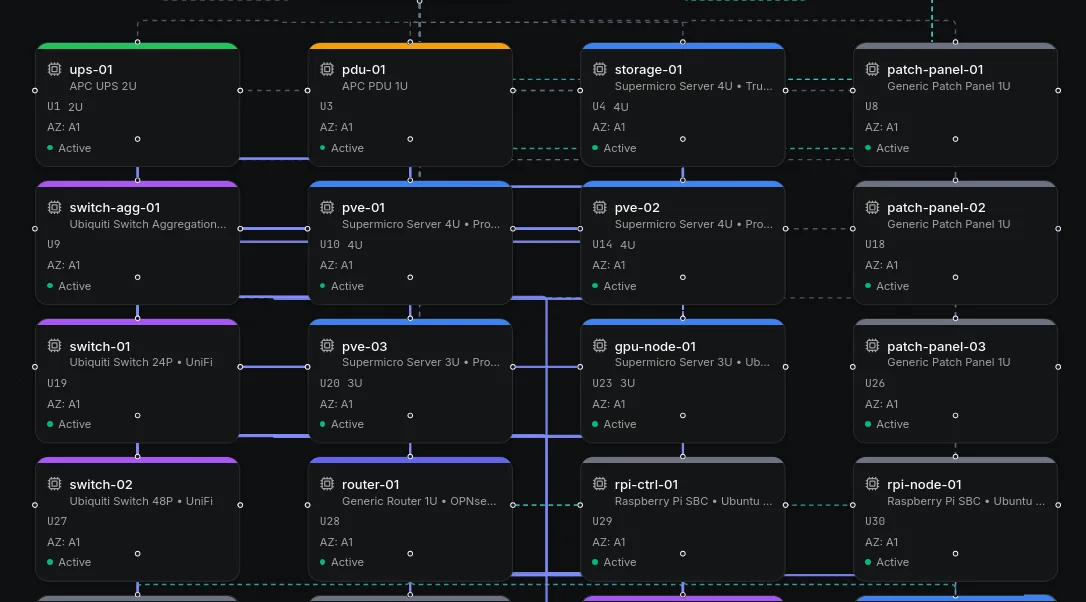
The Personal plan costs nothing and includes one user, one site, up to 30 devices, and the topology diagram. Choose Obelinf when you want inventory and the visual map to remain part of the same workflow. If your main requirement is automatic discovery from SNMP or LLDP, pair documentation with a discovery tool instead of expecting Obelinf to scan the network.
2. diagrams.net: Best for manual network diagrams
diagrams.net is a strong choice when you want to draw a network diagram yourself without buying a dedicated mapping product. It works in a browser, and its desktop application supports offline diagram editing. Use it for a design proposal, a small network with infrequent changes, or a clear one page drawing for a presentation.
The flexibility is also its main limitation: the diagram does not automatically update when a device or cable changes. Your team owns the layout and the maintenance process. Choose diagrams.net when you need drawing freedom and low cost; choose a data connected or discovery driven product when keeping the map current is the harder problem.
3. LibreNMS: Best for self hosted network discovery
LibreNMS builds dynamic network maps using discovered neighbor information such as CDP, LLDP, and related protocols, as well as MAC address data. It is a useful fit when you already run LibreNMS for network monitoring and want a map based on what its discovery process can see.
You will need to host and maintain the monitoring system, and the map depends on supported discovery data being available from your devices. It is not a freeform diagram editor or a complete infrastructure documentation workflow. Pick LibreNMS when self hosted monitoring and discovery matter more than manually recording every physical detail.
4. PRTG: Best for maps connected to monitoring
PRTG includes a Map Designer for custom dashboards built from monitored devices, status indicators, charts, and other monitoring objects. It suits teams that want a visual operations display alongside alerting and performance information, rather than a topology drawing alone.
PRTG Network Monitor has an on premises freeware edition limited to 100 sensors, while paid subscriptions scale by sensor count. Paessler currently lists its 500 sensor license at $200 per month when paid annually. A sensor represents one monitored aspect, so sensor capacity is not the same as device count. See Paessler’s current pricing before estimating your environment.
5. SolarWinds Network Topology Mapper: Best for automated Layer 2 and Layer 3 maps
SolarWinds Network Topology Mapper discovers network devices and connections and generates maps that include Layer 2 and Layer 3 topology. It is a better fit for network teams that want an automatically discovered map and need to export or share the result, rather than build a documentation workflow around manually maintained records.
SolarWinds lists Network Topology Mapper from $1,977, with a 14 day trial. It is a paid product with a different cost profile from free diagramming software or a self hosted monitoring stack. Confirm current licensing and product requirements with SolarWinds before purchasing.
How to evaluate a network topology tool
Before choosing a product, decide what the map needs to prove. An operations team may need to see current device status and the path affected by an outage. An architecture team may need a stable view of logical zones and dependencies. A facilities team may need rack positions, patch panels, and physical cable paths. These are related views, but one diagram rarely communicates all of them clearly. Write down the audience and the decisions they need to make, then choose a tool that can represent those relationships without hiding important detail.
Check where topology data comes from and how it changes. A manually drawn map depends on an owner remembering to update it. Discovery tools depend on credentials, polling, and protocols supported by the devices. A documentation driven map depends on the quality of maintained records. Ask what happens when a device is unreachable, a neighbor protocol is disabled, or an asset is created outside the normal workflow. A useful product makes uncertainty visible instead of presenting incomplete data as a complete map.
Also consider how the map fits the rest of the operating process. Can engineers trace a node to its inventory record, address, interface, and owner? Can they distinguish physical links from logical dependencies? Can they limit views to a site, environment, or service when the full network is too large? If a map must be exported, check whether the exported view remains readable and whether teams can update it without recreating the layout by hand.
Finally, review access controls, deployment effort, and ongoing ownership. A self hosted discovery platform may offer flexibility, but your team must maintain the host, credentials, upgrades, and polling configuration. A hosted inventory tool reduces that operational work, but you still need a process to keep records accurate. Include the time spent operating and reviewing the data in your comparison, not only the license price.
Run a small topology pilot
Test each candidate against one representative site or service before importing the entire network. Include a few switches, servers, a firewall, an upstream connection, and one dependency that crosses a site or cloud boundary. Verify that the tool can show the relationships your team actually uses, and ask an engineer who did not build the map to answer a realistic question with it. For example, have them trace which systems depend on a specific firewall or identify the interfaces involved in a planned link change.
Then simulate a normal change. Add a device, rename an interface, and remove or replace a connection. Observe how quickly the map reflects the change, what review is required, and whether an old relationship remains visible by mistake. Record missing data and ambiguous edges instead of correcting them silently. The pilot should reveal both the product’s capabilities and the inventory process your team would need to operate it.
Choose the tool that makes the map dependable for its intended use. Automatic discovery, monitoring overlays, hand drawn flexibility, and maintained infrastructure records solve different parts of the problem. A clear scope and a realistic update process matter as much as the visual layout.
Which network topology tool should you choose?
Start with the kind of truth you need the map to represent. Choose Obelinf when you want the diagram to reflect the inventory and connections your team maintains. Choose LibreNMS or SolarWinds when network discovery should supply the topology data. Choose PRTG when live monitoring information belongs on the map, and diagrams.net when you need to draw a custom diagram by hand.
No tool removes the need to decide what a useful topology should show. Separate physical connections from logical paths where that makes the map easier to read, and define how changes will be captured. Our network topology diagram best practices guide covers diagram scope, notation, and keeping drawings accurate over time.
If you want infrastructure records and topology in one place, explore Obelinf network topology and the Personal plan. For other teams, the best choice is the tool that matches the source of truth they can realistically keep current.
Frequently Asked Questions
What is the best network topology tool in 2026?
Which network topology tool is best for a homelab?
Do network topology tools automatically discover devices?
What is the difference between network diagram software and topology mapping software?
Free Tools
Put this into practice with the free calculators, reference tables, and checklists in the Obelinf toolkit.
Stop reaching for a spreadsheet
Obelinf keeps every subnet, device, circuit, and rack in one live source of truth, with audit logs and a topology view. Free for personal use.
Related Articles

Automated AWS Network Topology Diagram with AI
Connect AWS and Obelinf to an AI assistant, inventory cloud network resources, and turn verified records into an AWS network topology diagram.
Read more
Best Network Documentation Tools in 2026
We compared six network documentation tools, from SaaS to self hosted, across deployment, features, pricing, and operational overhead to help you choose the right one in 2026.
Read more
Hudu Alternatives in 2026: 5 Tools Compared
Looking for alternatives to Hudu in 2026? We compare Obelinf, IT Glue, ITFlow, NetBox, and phpIPAM across documentation scope, IPAM and DCIM depth, deployment, pricing, and when each tool makes sense for your team.
Read more